Spinn ATR tableThe table contains summary data on the ATR from different timeframes and for different periods. You can view both absolute values and the percentage of the average price move to the current price.
This data can be used to compare the ATR on different timeframes. And, most importantly, you can compare the ATR of different coins.
In addition, the last column shows the average deviation of the ATR for each of the timeframes. You can compare these values on different coins to determine which ones are more volatile .
Note.
Using the indicator on different timeframes may give slightly different values due to the difference in the stored data for these timeframes.
--
В таблице собраны сводные данные по ATR с разных таймфреймов и за разные периоды. Можно просматривать как абсолютные значения, так и процентное соотношение среднего хода цены к текущей цене.
Эти данные можно использовать, чтобы сравнить ATR на разных таймфреймах. И, самое главное, можно сравнивать ATR разных монет.
Кроме того, в последней колонке указано среднее отклонение ATR по каждому из таймфреймов. Можно сравнивать эти значения на разных монетах, чтобы определить - какие из них более волатильны .
Примечание.
Использование индикатора на разных таймфреймах может давать слегка разные значения из-за разницы в хранимых данных для этих таймфреймов.
在脚本中搜索" TABLE"


Multiple Indicator 50EMA Cross AlertsHere’s a screener including Symbol, Price, TSI, and 50 ema cross in a table output.
The 50 Exponential Moving Average is a trend indicator
You can find bullish momentum when the 50 ema crossed over or a bearish momentum when the 50 ema crossed under we are looking to take advantage by trading the reversion of these trends.
True strength index (TSI) is a trend momentum indicator
Readings are bullish when the True Strength Index shows positive values
Readings are bearish when the indicator displays negative values.
When a value is above 20, we look for selling overbought opportunity and when the value is under 20, we look for buying oversold opportunity.
You can select the pair of your choice in the settings.
Make sure to create an alert and choose any alerts then an alert will trigger when a price cross under or cross over the 50 ema for every pair separately.
This allow the user to verify if there is a trade set up or not.
Disclaimer
This post and the script don’t provide any financial advice.

Performance Table From OpenThis indicator plots the percentage performance from the open of up to 20 different customizable tickers.
Enjoy!

[Nic] Intraday Vix LabelsPrints intraday percent change of VIX9D, VVIX, PCC, and any other arbitrary symbol on a table for quick reference.

BTC Futures BasisShows various basis percentages in a table and plots historical basis. Also has an alert function for backwardation events. Useful for tracking bullish/bearish sentiment in BTC futures markets.
*Currently displays March and June futures for the following exchanges: Bitmex, Binance, Deribit, Okex, and FTX
Also displays CME Continuous Next Contract. All of the symbols are customizable.
-----------
Market-wide backwardation usually occurs during a heavy sell-off (such as a liquidation cascade).
**For getting alerts of backwardation events, I recommend creating an alert on the 1 minute chart with the condition "Any alert() function call". Alert level is customizable as well.
-----------
*NOTE!! : Futures contracts expire (obviously), so the contract symbols will need to be updated periodically. I will try to keep them updated going into the future.
**NOTE2!! : The alert() function does not track the CME contract. This is to avoid false triggers.

SPY Sub-Sector Daily Money Flow TableThis calculates the dollar volume per candlestick (2nd row) and cumulative (3rd row) of the entire trading day for each subsector of the SPY.
The 'Total' column is the total of all the subsectors combined. It is calculated separately from SPY volume.
The money flow is calculated with (open+close)/2 which means different timeframes yield different results and won't be especially accurate day-by-day. This is useful to quickly see rotation and possible divergences.
Enjoy!

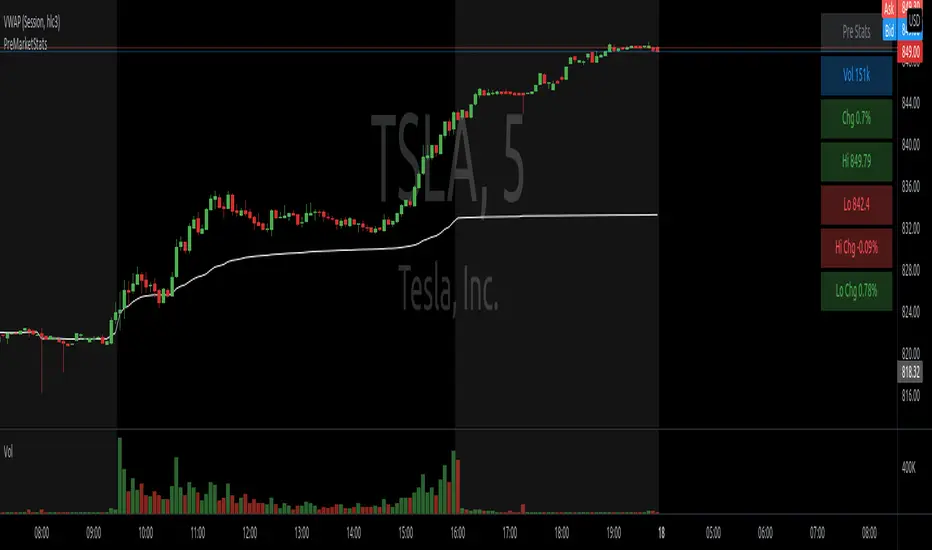
PreMarketStatsThe idea is to catch pre market information (or other relevant data), that basically consists of a single number, in a table instead of using a plot that takes up space in the chart. In this example, I added pre market volume and pre market change in %. Where the second one is as well available in the details tab of the stock, it is not available if this tab is closed or during replays.
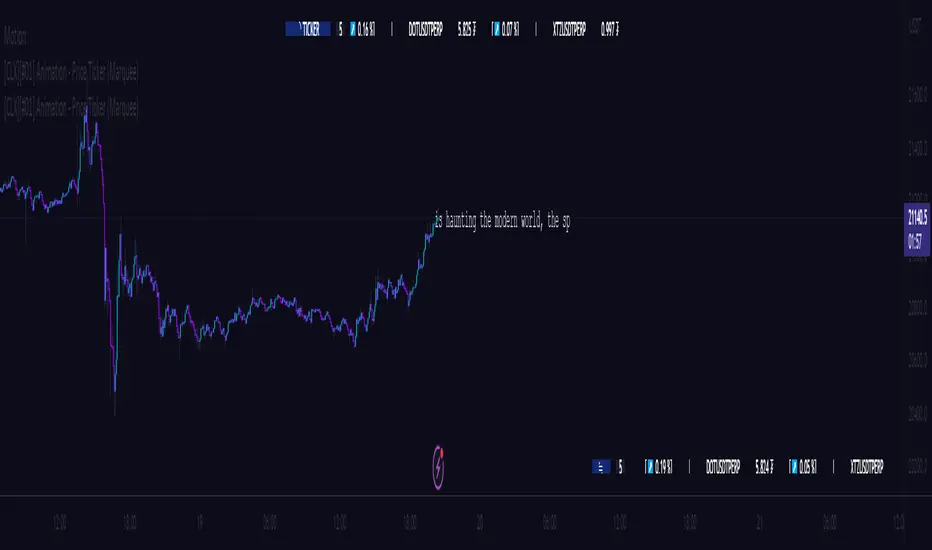
[CLX][#01] Animation - Price Ticker (Marquee)This indicator displays a classic animated price ticker overlaid on the user’s current chart. It is possible to fully customize it or to select one of the predefined styles.
A detailed description will follow in the next few days.
Used Pinescript technics:
- varip (view/animation)
- tulip instance (config/codestructur)
- table (view/position)
By the way, for me, one of the coolest animated effects is by Duyck
We hope you enjoy it! 🎉
CRYPTOLINX - jango_blockchained 😊👍
Disclaimer:
Trading success is all about following your trading strategy and the indicators should fit within your trading strategy, and not to be traded upon solely.
The script is for informational and educational purposes only. Use of the script does not constitute professional and/or financial advice. You alone have the sole responsibility of evaluating the script output and risks associated with the use of the script. In exchange for using the script, you agree not to hold dgtrd TradingView user liable for any possible claim for damages arising from any decision you make based on use of the script.
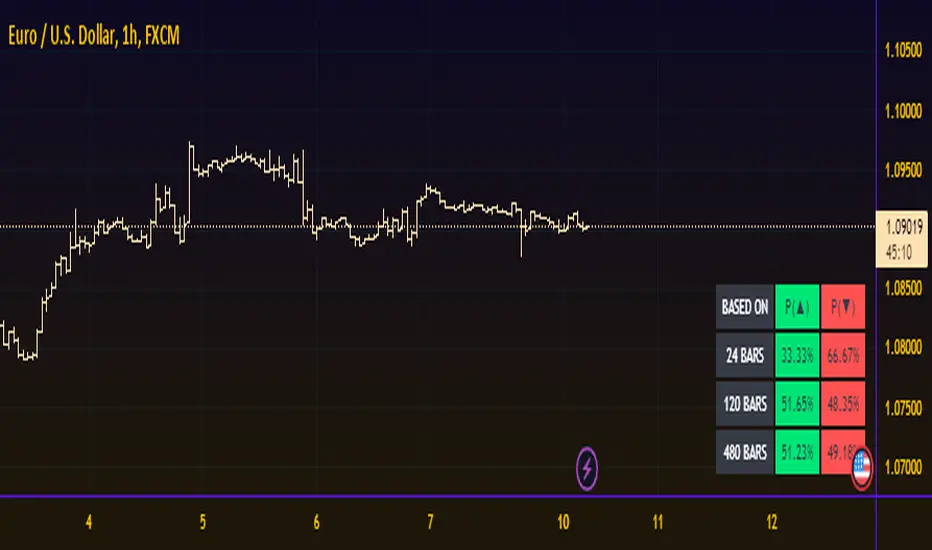
Probability TableThe script is inspired by user NickbarComb, I suggested checking out his Price Convergence script.
Basically, this script plots a table containing the probability of the current candle closing either higher or lower based on user-define past period.
Hope that it will be helpful.
MTF Price/Volume % [Anan]Hello friends,
This is a multi-timeframe table with these features:
Display price change percentage compared with the last timeframe candle close.
Display price change percentage compared with the last timeframe candle close MA.
Displays change percentage compared with the last timeframe candle volume.
Displays change percentage compared with the last timeframe candle volume MA.
Change type/length of MA for Price/Volume.
Full control of Panel position and size.
Full control of displaying any row or column.

Average Daily Range TableThis is the last script to complete Vladimir Poltoratskiy's setup found in his books.
Poltoratskiy argues that you should not take any fractal corridors higher than 50% of the Average Daily Range. To be honest, even 40% is a lot, because then, your target will be 160% ADR away from your entry and one "fracture" just can't be enough to predict moves this big.
I chose a table to visually represent the indicator because it doesn't change its value during the day. It takes far less room on the chart.
There are also two simple moving averages. You may use the as an indicator if the relative volatility as of late is extremely low and in that case, perhaps, expect an increase in the coming days. They are applied to the Average Daily Range, not one day range!

PAC newThis indicator will alert you when a candle goes above or below the price action channel (PAC) but only on the first or second candle after a colour change in candle.
When price is above the price action channel that is a bullish sign, when price is below the PAC that is a bearish sign.
The idea is that a sudden change in price is a cause to investigate further price action moving in that direction so the indicator aims to identify reversal
Scalping strategy that works on 5 min chart and aims to gain 10 pips. Do not act on every signal. Further investigation is required, for example by looking at RSI oversolf and overbought levels. For example, at an oversold area, a buy signal is more valid
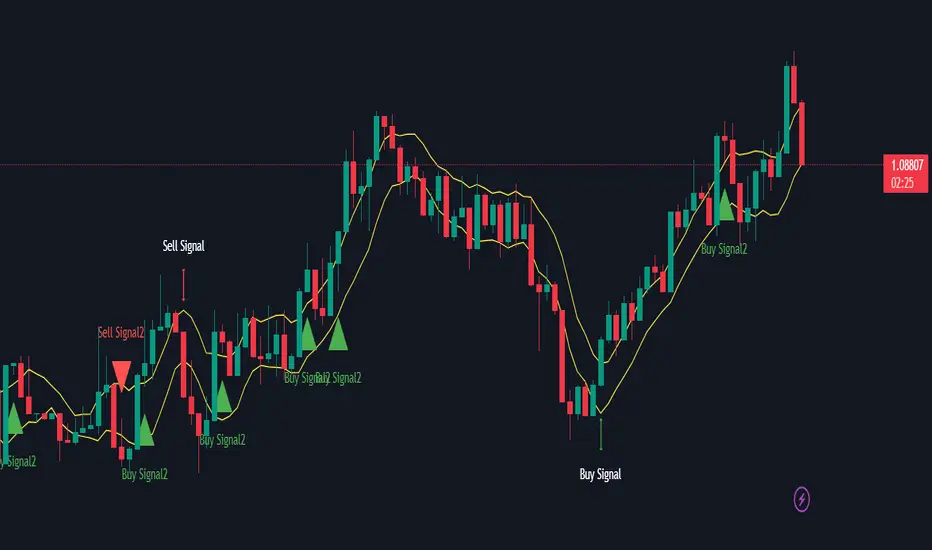
Table: Forex Central Bank Interest RatesThis tool shows CB Interest Rates for USD, JPY, CAD, CHF, EUR, GBP, NZD, AUD - basically all the majors.
Use override and input your own value if it is changed and I haven't updated the script yet.

Month/Month Percentage % Change, Historical; Seasonal TendencyTable of monthly % changes in Average Price over the last 10 years (or the 10 yrs prior to input year).
Useful for gauging seasonal tendencies of an asset; backtesting monthly volatility and bullish/bearish tendency.
~~User Inputs~~
Choose measure of average: sma(close), sma(ohlc4), vwap(close), vwma(close).
Show last 10yrs, with 10yr average % change, or to just show single year.
Chose input year; with the indicator auto calculating the prior 10 years.
Choose color for labels and size for labels; choose +Ve value color and -Ve value color.
Set 'Daily bars in month': 21 for Forex/Commodities/Indices; 30 for Crypto.
Set precision: decimal places
~~notes~~
-designed for use on Daily timeframe (tradingview is buggy on monthly timeframe calculations, and less precise on weekly timeframe calculations).
-where Current month of year has not occurred yet, will print 9yr average.
-calculates the average change of displayed month compared to the previous month: i.e. Jan22 value represents whole of Jan22 compared to whole of Dec21.
-table displays on the chart over the input year; so for ES, with 2010 selected; shows values from 2001-2010, displaying across 2010-2011 on the chart.
-plots on seperate right hand side scale, so can be shrunk and dragged vertically.
-thanks to @gabx11 for the suggestion which inspired me to write this

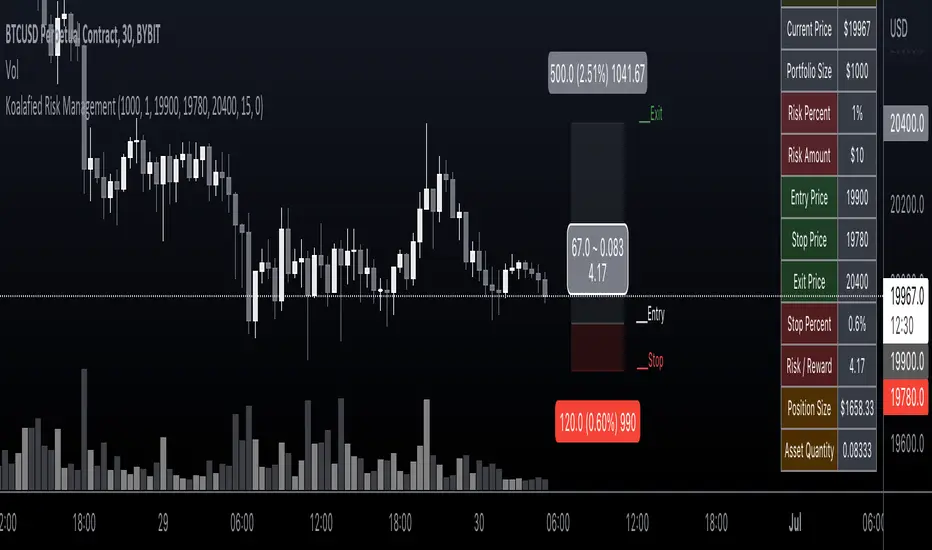
Koalafied Risk ManagementTables and labels/lines showing trade levels and risk/reward. Use to manage trade risk compared to portfolio size.
Initial design optimised for tickers denominated against USD.
Multi-Session High/Low Trackertable that shows rth eth and full weekly range high and low with range difference from high and low

Table ATH and DayQuotes in the middle of a chartJust important things at a glance ..
AlltimeHigh and Daily High/Low

YM Ultimate SNIPER v8 final# YM Ultimate SNIPER v8 - Complete Documentation
## 🎯 WIN AT ALL COST EDITION
### FIXED: Scoring System + Solid Table + All Timeframes + Filtered Visuals
**TARGET: 3-7 High-Confluence Trades per Day**
**Philosophy: "Zones That Matter" + "See Inside The Candle"**
---
# 📋 QUICK START CHEATSHEET
## ⚡ 60-SECOND SETUP
### Step 1: Add to Chart
1. Open TradingView → Indicators → Pine Editor
2. Paste the v8 code → Save → Add to Chart
3. Use 5-minute chart for day trading
### Step 2: Verify Settings (YM Default)
```
TIER THRESHOLDS:
├── S-Tier: 50 points (institutional sweep)
├── A-Tier: 25 point# YM Ultimate SNIPER v8 - Complete Documentation
## 🎯 WIN AT ALL COST EDITION
### FIXED: Scoring System + Solid Table + All Timeframes + Filtered Visuals
**TARGET: 3-7 High-Confluence Trades per Day**
**Philosophy: "Zones That Matter" + "See Inside The Candle"**
---
# 📋 QUICK START CHEATSHEET
## ⚡ 60-SECOND SETUP
### Step 1: Add to Chart
1. Open TradingView → Indicators → Pine Editor
2. Paste the v8 code → Save → Add to Chart
3. Use 5-minute chart for day trading
### Step 2: Verify Settings (YM Default)
```
TIER THRESHOLDS:
├── S-Tier: 50 points (institutional sweep)
├── A-Tier: 25 points (strong momentum)
└── B-Tier: 12 points (quick scalp)
INTRABAR: 1-minute (most precise)
SESSIONS: NY Window (0930-1130) ← Primary focus
```
### Step 3: Look for These Signals
```
⚡GOD = GOD MODE (9.0+ score) → TAKE IT NOW, full size
S🎯 = S-Tier HOLD → 2.5-3.5 R:R target
A🎯 = A-Tier SWING → 2.0-2.5 R:R target
B🎯 = B-Tier SCALP → 1.5-2.0 R:R target
Z = Zone entry (no tier but quality zone)
LS↑/↓ = Liquidity Sweep (filtered for quality)
✕ = Absorption (filtered for quality)
```
---
# 🔥 THE SCORE SYSTEM (v8 REBUILT)
## How It Works Now
The score is **100% ADDITIVE** - no more gating. Every factor adds points:
| Category | Factor | Points |
|----------|--------|--------|
| **TIER** | S-Tier | +3.0 |
| | A-Tier | +2.0 |
| | B-Tier | +1.0 |
| **ZONES** | In FVG Zone | +1.5 |
| | In Order Block | +1.5 |
| | In IFVG | +1.0 |
| **VOLUME** | Meets minimum (1.5x) | +0.5 |
| | Strong (2.0x) | +0.75 |
| | Extreme (2.5x) | +0.75 |
| **DELTA** | Buy/Sell dominant (60%+) | +1.0 |
| | Strong (70%+) | +0.5 |
| | Extreme (78%+) | +0.5 |
| **CVD** | Bullish/Bearish | +0.5 |
| | Strong momentum | +0.5 |
| | Extreme momentum | +0.5 |
| **CANDLE** | Strong body (60%+) | +0.5 |
| | Significant range (1.2x avg) | +0.5 |
| | Clean wicks | +0.5 |
| **SWEEP** | Recent sweep (within 3 bars) | +1.5 |
| | Current bar sweep | +0.5 |
| **SESSION** | In key session | +1.0 |
| **INTRABAR** | IB Delta dominant | +1.0 |
| | IB Delta strong | +0.5 |
| | IB Delta extreme | +0.5 |
| | IB Momentum confirmed | +0.5 |
| | IB Momentum strong | +0.5 |
| | Absorption detected | +1.0 |
| | Internal sweep | +0.5 |
| | Volume cluster (favorable) | +0.5 |
**Max Raw Score: ~22 points → Normalized to 10**
## Score Classifications
| Score | Classification | Action | Size |
|-------|---------------|--------|------|
| **9.0-10** | ⚡ GOD MODE | TAKE IT NOW | Full position |
| **8.0-8.9** | ⭐ EXCELLENT | High priority | 75-100% size |
| **5.0-7.9** | 🟡 MEDIUM | Standard setup | 50-75% size |
| **<5.0** | ❌ NO SIGNAL | No trade | — |
---
# 📊 INSTRUMENT-SPECIFIC SETUP
## YM (Dow Jones Mini) - DEFAULT
```
TIER THRESHOLDS:
├── S-Tier: 50 points
├── A-Tier: 25 points
└── B-Tier: 12 points
TICK VALUE: 1.00 (1 tick = 1 point)
CONTRACT VALUE: $5 per point
RECOMMENDED:
├── Chart: 5-minute
├── Intrabar TF: 1 (1-minute) OR 100T (tick for Premium+)
├── Sessions: NY Open (9:30-11:30)
└── Stop: 2 ticks below signal candle low
PRO TIP: Use 100T or 250T tick intrabar for true order flow
```
## NQ (Nasdaq Mini)
```
TIER THRESHOLDS:
├── S-Tier: 100 points
├── A-Tier: 50 points
└── B-Tier: 25 points
TICK VALUE: 0.25 (4 ticks = 1 point)
CONTRACT VALUE: $5 per point ($20 per tick)
RECOMMENDED:
├── Chart: 5-minute
├── Intrabar TF: 1 (1-minute)
├── Min Volume Ratio: 1.8 (more volatile)
├── Delta Threshold: 0.62 (stricter)
└── Sessions: NY Open + Power Hour
```
## GC (Gold)
```
TIER THRESHOLDS:
├── S-Tier: 20 points (=$200)
├── A-Tier: 10 points (=$100)
└── B-Tier: 5 points (=$50)
TICK VALUE: 0.10 (10 ticks = 1 point)
CONTRACT VALUE: $10 per point ($1 per tick)
RECOMMENDED:
├── Chart: 5-minute
├── Intrabar TF: 1 (1-minute)
├── Sessions: London + NY overlap
├── Min Volume Ratio: 1.5
└── Note: More responsive to geopolitical events
```
## BTC (Bitcoin Futures)
```
TIER THRESHOLDS:
├── S-Tier: 500 points
├── A-Tier: 250 points
└── B-Tier: 100 points
TICK VALUE: 5.00 (1 tick = 5 points)
CONTRACT VALUE: $5 per point
RECOMMENDED:
├── Chart: 15-minute (less noise)
├── Intrabar TF: 5 (5-minute)
├── Sessions: Consider 24/7 (disable session filter)
├── Min Volume Ratio: 2.0 (crypto is spiky)
├── Absorption Threshold: 0.70 (stricter)
└── Note: Higher volatility, use wider stops
```
## ES (S&P 500 Mini)
```
TIER THRESHOLDS:
├── S-Tier: 20 points
├── A-Tier: 10 points
└── B-Tier: 5 points
TICK VALUE: 0.25 (4 ticks = 1 point)
CONTRACT VALUE: $12.50 per point ($50 per tick)
RECOMMENDED:
├── Chart: 5-minute
├── Intrabar TF: 1 (1-minute)
├── Sessions: NY Open (primary)
├── Note: Most liquid, cleanest price action
└── Good for learning the system
```
---
# 🕐 INTRABAR TIMEFRAME GUIDE
## Available Timeframes (v8 COMPLETE!)
### TICK TIMEFRAMES (Premium+ Required)
| Timeframe | Code | Best For |
|-----------|------|----------|
| 1 Tick | 1T | **ULTIMATE PRECISION** - every single trade |
| 5 Ticks | 5T | Ultra-precise scalping |
| 10 Ticks | 10T | High-frequency analysis |
| 25 Ticks | 25T | Tick scalping |
| 50 Ticks | 50T | Short-term tick analysis |
| 100 Ticks | 100T | Standard tick analysis |
| 250 Ticks | 250T | Medium tick grouping |
| 500 Ticks | 500T | Larger tick grouping |
| 1000 Ticks | 1000T | High-level tick view |
### SECOND TIMEFRAMES
| Timeframe | Code | Best For |
|-----------|------|----------|
| 1 Second | 1S | Ultra-scalping |
| 5 Seconds | 5S | Scalping, high-frequency |
| 10 Seconds | 10S | Fast scalping |
| 15 Seconds | 15S | Quick scalps |
| 30 Seconds | 30S | Short-term scalps |
### MINUTE TIMEFRAMES
| Timeframe | Code | Best For |
|-----------|------|----------|
| 1 Minute | 1 | **RECOMMENDED** for 5m charts |
| 2 Minutes | 2 | 10m charts |
| 3 Minutes | 3 | 15m charts |
| 5 Minutes | 5 | 15-30m charts |
| 10 Minutes | 10 | 30m-1h charts |
| 15 Minutes | 15 | 1h charts |
| 30 Minutes | 30 | 1-2h charts |
| 45 Minutes | 45 | 2-4h charts |
| 1 Hour | 60 | 4h charts |
| 2 Hours | 120 | Daily charts |
| 3 Hours | 180 | Daily charts |
| 4 Hours | 240 | Weekly charts |
### HIGHER TIMEFRAMES
| Timeframe | Code | Best For |
|-----------|------|----------|
| Daily | D | Weekly/Monthly charts |
| Weekly | W | Monthly charts |
| Monthly | M | Long-term analysis |
## 🔥 TICK DATA ADVANTAGE
**Why Use Tick Data?**
- **True Order Flow**: See every single transaction
- **No Time Aggregation**: Pure price/volume action
- **Institutional Footprint**: Catch block trades instantly
- **Maximum IB Precision**: Most accurate delta/momentum
**Best Tick Settings by Instrument:**
| Instrument | Chart TF | Recommended Tick IB |
|------------|----------|---------------------|
| YM | 5 min | 100T or 250T |
| NQ | 5 min | 50T or 100T (more liquid) |
| ES | 5 min | 50T or 100T (most liquid) |
| GC | 5 min | 100T or 250T |
| BTC | 15 min | 250T or 500T |
## ⚠️ CRITICAL RULE
**Intrabar TF MUST be LOWER than your chart TF!**
### Automatic Validation (v8 NEW!)
The script now automatically detects invalid intrabar configurations:
**When Intrabar TF is INVALID:**
1. **Yellow warning label** appears on chart: "⚠️ INTRABAR TF INVALID"
2. **Table shows**: "IB Data: ⚠️ INVALID TF" with yellow background
3. **Alert available**: "⚠️ INTRABAR CONFIG ERROR"
4. **Score impact**: Intrabar points (up to 5) are NOT added
**Example - 2 Minute Chart:**
```
VALID selections: 1T, 5T, 10T, 25T, 50T, 100T (any tick)
1S, 5S, 10S, 15S, 30S (any second)
1 (1-minute only)
INVALID selections: 2, 3, 5, 10, 15... (2min or higher)
D, W, M (obviously)
```
| Your Chart | Valid Intrabar Options |
|------------|------------------------|
| **2 minute** | **1T-1000T, 1S-30S, 1 only** |
| 5 minute | 1T-1000T, 1S-30S, 1-4 min |
| 15 minute | 1T-1000T, 1S-30S, 1-10 min |
| 1 hour | 1T-1000T, 1S-30S, 1-45 min |
| 4 hour | 1T-1000T, 1S-30S, 1-180 min |
| Daily | All tick, seconds, minutes up to 240 |
---
# 🎨 VISUAL FILTERING (v8 NEW!)
## The Problem (v7)
Too many sweep and absorption markers cluttered the chart with low-quality signals.
## The Solution (v8)
**Quality filters** - only show sweeps/absorption that MATTER.
### Sweep Quality Score
A sweep needs confluence to display:
```
+1.5 = In FVG Zone
+1.5 = In Order Block
+1.0 = Strong volume
+0.5 = In session
+1.0 = Intrabar confirmation
───────────────────
MIN NEEDED: 2.0 to show
```
### Absorption Quality Score
```
+1.5 = In FVG Zone
+1.5 = In Order Block
+1.0 = Tier signal present
+0.5 = In session
+0.5 = CVD confirmation
───────────────────
MIN NEEDED: 2.0 to show
```
### Settings
```
VISUAL FILTERS:
├── Only Show Quality Sweeps: ON (default)
├── Only Show Quality Absorption: ON (default)
├── Min Sweep Quality Score: 2.0
└── Min Absorption Quality Score: 2.0
Turn OFF filters to see ALL signals (not recommended)
```
---
# 📈 CVD IMPLEMENTATION (v8 FIXED)
## What Changed
### v7 Issues:
- CVD accumulated forever (overflow risk)
- Short slope calculation (only 3 bars)
- No session reset
### v8 Fixes:
```
1. SESSION RESET: CVD resets at London/NY open
2. PROPER SLOPE: Calculated over 5 bars
3. STDEV COMPARISON: Strong/Extreme = slope > 1-2 stdev
```
## CVD Readings in Table
| Display | Meaning | Score Contribution |
|---------|---------|-------------------|
| 🔥 BULL | Extreme bullish momentum | +1.5 total |
| 🔥 BEAR | Extreme bearish momentum | +1.5 total |
| ↑ BULL | Strong bullish trend | +1.0 total |
| ↓ BEAR | Strong bearish trend | +1.0 total |
| bull | Bullish bias | +0.5 |
| bear | Bearish bias | +0.5 |
| — | Neutral/mixed | +0 |
---
# ✅ ENTRY CHECKLIST v8
## Quick Checklist (Print This!)
### For ANY Signal:
- Score ≥ 3.5 (signal shown)
- Session active (🟢 in table)
- Direction matches bias
### For MEDIUM+ Signal (Score 5.0+):
- Delta matches direction (✓ or better)
- CVD trending with signal
- Volume ≥ 1.5x average
### For EXCELLENT Signal (Score 7.0+):
All above PLUS:
- In FVG Zone OR Order Block
- Strong delta (✓✓) or extreme (🔥)
- IB Delta confirms direction
### For GOD MODE (Score 8.5+):
All above PLUS:
- Multiple structure confluence (FVG + OB)
- Absorption or sweep present
- IB Momentum strong (🔥)
- **FULL SIZE - DON'T HESITATE**
---
# ⛔ DO NOT TRADE
1. **Score below threshold** - No signal shown = no trade
2. **Outside session** - Unless you've disabled session filter
3. **Delta conflicts** - Bearish candle but buy dominant delta
4. **No intrabar data** - Shows "0 bars" in IB Data
5. **CVD strongly opposite** - 🔥 BEAR on a long signal
6. **After major news** - Wait for dust to settle
7. **Low volume overall** - Market too quiet
---
# 🏆 GOLDEN RULES v8
> **"The score doesn't lie. Trust the math."**
> **"GOD MODE = Don't think, just execute."**
> **"Filtered visuals = Quality over quantity."**
> **"If intrabar conflicts, trust intrabar."**
> **"Session matters - trade when institutions trade."**
> **"Stack confluence - score higher = win more."**
> **"Leave every trade with money. Next setup is coming."**
---
# 📝 TRADE JOURNAL v8
```
DATE: ___________
SESSION: ☐ LDN ☐ NY ☐ PWR
INSTRUMENT: YM / NQ / ES / GC / BTC
TRADE:
├── Time: _______
├── Signal: ⚡GOD / S🎯 / A🎯 / B🎯 / Z
├── Direction: LONG / SHORT
├── SCORE: ___/10
├── Classification: GOD MODE / EXCELLENT / MEDIUM / WEAK
│
├── Entry: _______
├── Stop: _______
├── Target: _______
│
├── In FVG Zone: ☐ Yes ☐ No
├── In Order Block: ☐ Yes ☐ No
├── Liquidity Sweep: ☐ Yes ☐ No
├── Absorption: ☐ Yes ☐ No
│
├── IB Delta: ____% (BULL / BEAR / NEUTRAL)
├── IB Momentum: ____% (BULL / BEAR / MIXED)
├── CVD: 🔥 / ↑↓ / neutral
│
├── Result: +/- ___ pts ($_____)
└── Notes: _______________________
DAILY SUMMARY:
├── Total Trades: ___
├── GOD MODE signals: ___
├── EXCELLENT signals: ___
├── Win Rate: ___%
├── Net P/L: $_____
└── Best score today: ___
```
---
# 🔧 TROUBLESHOOTING
| Issue | Solution |
|-------|----------|
| **Yellow "INVALID TF" warning** | Your intrabar TF is >= chart TF. Select LOWER! |
| **IB Data shows "⚠️ INVALID TF"** | Same as above - pick 1T, 1S, or 1 for most charts |
| No signals appearing | Lower Min Score threshold |
| Too many signals | Raise Min Score threshold |
| Score always 0 | Check if candle is tiered (meets point threshold) |
| Sweeps not showing | Check quality filter settings or lower threshold |
| Table transparent | ❌ Fixed in v8 - table is now solid |
| CVD not making sense | Now resets at session open - cleaner readings |
| Wrong tier thresholds | Adjust for your instrument (see setup guide) |
| Tick TF not available | Requires TradingView Premium+ subscription |
---
# 📚 VERSION HISTORY
## v8 - WIN AT ALL COST EDITION
- ✅ REBUILT scoring system (100% additive, no gating)
- ✅ SOLID table (no transparency)
- ✅ ALL TradingView timeframes for intrabar (1S to Monthly)
- ✅ FILTERED sweeps/absorption (quality-based)
- ✅ FIXED CVD (session reset, proper slope)
- ✅ GOD MODE classification (8.5+ score)
- ✅ Instrument-specific documentation
## v7 - Intrabar Edition
- Added intrabar analysis engine
- Added absorption detection
- Added internal sweep detection
## Previous Versions
- GRA v5 SNIPER + DeepFlow Zones SNIPER merged
---
*© Alexandro Disla - YM Ultimate SNIPER v8*
*WIN AT ALL COST Edition | Trust The Score*
s (strong momentum)
└── B-Tier: 12 points (quick scalp)
INTRABAR: 1-minute (most precise)
SESSIONS: NY Window (0930-1130) ← Primary focus
```
### Step 3: Look for These Signals
```
⚡GOD = GOD MODE (9.0+ score) → TAKE IT NOW, full size
S🎯 = S-Tier HOLD → 2.5-3.5 R:R target
A🎯 = A-Tier SWING → 2.0-2.5 R:R target
B🎯 = B-Tier SCALP → 1.5-2.0 R:R target
Z = Zone entry (no tier but quality zone)
LS↑/↓ = Liquidity Sweep (filtered for quality)
✕ = Absorption (filtered for quality)
```
---
# 🔥 THE SCORE SYSTEM (v8 REBUILT)
## How It Works Now
The score is **100% ADDITIVE** - no more gating. Every factor adds points:
| Category | Factor | Points |
|----------|--------|--------|
| **TIER** | S-Tier | +3.0 |
| | A-Tier | +2.0 |
| | B-Tier | +1.0 |
| **ZONES** | In FVG Zone | +1.5 |
| | In Order Block | +1.5 |
| | In IFVG | +1.0 |
| **VOLUME** | Meets minimum (1.5x) | +0.5 |
| | Strong (2.0x) | +0.75 |
| | Extreme (2.5x) | +0.75 |
| **DELTA** | Buy/Sell dominant (60%+) | +1.0 |
| | Strong (70%+) | +0.5 |
| | Extreme (78%+) | +0.5 |
| **CVD** | Bullish/Bearish | +0.5 |
| | Strong momentum | +0.5 |
| | Extreme momentum | +0.5 |
| **CANDLE** | Strong body (60%+) | +0.5 |
| | Significant range (1.2x avg) | +0.5 |
| | Clean wicks | +0.5 |
| **SWEEP** | Recent sweep (within 3 bars) | +1.5 |
| | Current bar sweep | +0.5 |
| **SESSION** | In key session | +1.0 |
| **INTRABAR** | IB Delta dominant | +1.0 |
| | IB Delta strong | +0.5 |
| | IB Delta extreme | +0.5 |
| | IB Momentum confirmed | +0.5 |
| | IB Momentum strong | +0.5 |
| | Absorption detected | +1.0 |
| | Internal sweep | +0.5 |
| | Volume cluster (favorable) | +0.5 |
**Max Raw Score: ~22 points → Normalized to 10**
## Score Classifications
| Score | Classification | Action | Size |
|-------|---------------|--------|------|
| **9.0-10** | ⚡ GOD MODE | TAKE IT NOW | Full position |
| **8.0-8.9** | ⭐ EXCELLENT | High priority | 75-100% size |
| **5.0-7.9** | 🟡 MEDIUM | Standard setup | 50-75% size |
| **<5.0** | ❌ NO SIGNAL | No trade | — |
---
# 📊 INSTRUMENT-SPECIFIC SETUP
## YM (Dow Jones Mini) - DEFAULT
```
TIER THRESHOLDS:
├── S-Tier: 50 points
├── A-Tier: 25 points
└── B-Tier: 12 points
TICK VALUE: 1.00 (1 tick = 1 point)
CONTRACT VALUE: $5 per point
RECOMMENDED:
├── Chart: 5-minute
├── Intrabar TF: 1 (1-minute) OR 100T (tick for Premium+)
├── Sessions: NY Open (9:30-11:30)
└── Stop: 2 ticks below signal candle low
PRO TIP: Use 100T or 250T tick intrabar for true order flow
```
## NQ (Nasdaq Mini)
```
TIER THRESHOLDS:
├── S-Tier: 100 points
├── A-Tier: 50 points
└── B-Tier: 25 points
TICK VALUE: 0.25 (4 ticks = 1 point)
CONTRACT VALUE: $5 per point ($20 per tick)
RECOMMENDED:
├── Chart: 5-minute
├── Intrabar TF: 1 (1-minute)
├── Min Volume Ratio: 1.8 (more volatile)
├── Delta Threshold: 0.62 (stricter)
└── Sessions: NY Open + Power Hour
```
## GC (Gold)
```
TIER THRESHOLDS:
├── S-Tier: 20 points (=$200)
├── A-Tier: 10 points (=$100)
└── B-Tier: 5 points (=$50)
TICK VALUE: 0.10 (10 ticks = 1 point)
CONTRACT VALUE: $10 per point ($1 per tick)
RECOMMENDED:
├── Chart: 5-minute
├── Intrabar TF: 1 (1-minute)
├── Sessions: London + NY overlap
├── Min Volume Ratio: 1.5
└── Note: More responsive to geopolitical events
```
## BTC (Bitcoin Futures)
```
TIER THRESHOLDS:
├── S-Tier: 500 points
├── A-Tier: 250 points
└── B-Tier: 100 points
TICK VALUE: 5.00 (1 tick = 5 points)
CONTRACT VALUE: $5 per point
RECOMMENDED:
├── Chart: 15-minute (less noise)
├── Intrabar TF: 5 (5-minute)
├── Sessions: Consider 24/7 (disable session filter)
├── Min Volume Ratio: 2.0 (crypto is spiky)
├── Absorption Threshold: 0.70 (stricter)
└── Note: Higher volatility, use wider stops
```
## ES (S&P 500 Mini)
```
TIER THRESHOLDS:
├── S-Tier: 20 points
├── A-Tier: 10 points
└── B-Tier: 5 points
TICK VALUE: 0.25 (4 ticks = 1 point)
CONTRACT VALUE: $12.50 per point ($50 per tick)
RECOMMENDED:
├── Chart: 5-minute
├── Intrabar TF: 1 (1-minute)
├── Sessions: NY Open (primary)
├── Note: Most liquid, cleanest price action
└── Good for learning the system
```
---
# 🕐 INTRABAR TIMEFRAME GUIDE
## Available Timeframes (v8 COMPLETE!)
### TICK TIMEFRAMES (Premium+ Required)
| Timeframe | Code | Best For |
|-----------|------|----------|
| 1 Tick | 1T | **ULTIMATE PRECISION** - every single trade |
| 5 Ticks | 5T | Ultra-precise scalping |
| 10 Ticks | 10T | High-frequency analysis |
| 25 Ticks | 25T | Tick scalping |
| 50 Ticks | 50T | Short-term tick analysis |
| 100 Ticks | 100T | Standard tick analysis |
| 250 Ticks | 250T | Medium tick grouping |
| 500 Ticks | 500T | Larger tick grouping |
| 1000 Ticks | 1000T | High-level tick view |
### SECOND TIMEFRAMES
| Timeframe | Code | Best For |
|-----------|------|----------|
| 1 Second | 1S | Ultra-scalping |
| 5 Seconds | 5S | Scalping, high-frequency |
| 10 Seconds | 10S | Fast scalping |
| 15 Seconds | 15S | Quick scalps |
| 30 Seconds | 30S | Short-term scalps |
### MINUTE TIMEFRAMES
| Timeframe | Code | Best For |
|-----------|------|----------|
| 1 Minute | 1 | **RECOMMENDED** for 5m charts |
| 2 Minutes | 2 | 10m charts |
| 3 Minutes | 3 | 15m charts |
| 5 Minutes | 5 | 15-30m charts |
| 10 Minutes | 10 | 30m-1h charts |
| 15 Minutes | 15 | 1h charts |
| 30 Minutes | 30 | 1-2h charts |
| 45 Minutes | 45 | 2-4h charts |
| 1 Hour | 60 | 4h charts |
| 2 Hours | 120 | Daily charts |
| 3 Hours | 180 | Daily charts |
| 4 Hours | 240 | Weekly charts |
### HIGHER TIMEFRAMES
| Timeframe | Code | Best For |
|-----------|------|----------|
| Daily | D | Weekly/Monthly charts |
| Weekly | W | Monthly charts |
| Monthly | M | Long-term analysis |
## 🔥 TICK DATA ADVANTAGE
**Why Use Tick Data?**
- **True Order Flow**: See every single transaction
- **No Time Aggregation**: Pure price/volume action
- **Institutional Footprint**: Catch block trades instantly
- **Maximum IB Precision**: Most accurate delta/momentum
**Best Tick Settings by Instrument:**
| Instrument | Chart TF | Recommended Tick IB |
|------------|----------|---------------------|
| YM | 5 min | 100T or 250T |
| NQ | 5 min | 50T or 100T (more liquid) |
| ES | 5 min | 50T or 100T (most liquid) |
| GC | 5 min | 100T or 250T |
| BTC | 15 min | 250T or 500T |
## ⚠️ CRITICAL RULE
**Intrabar TF MUST be LOWER than your chart TF!**
### Automatic Validation (v8 NEW!)
The script now automatically detects invalid intrabar configurations:
**When Intrabar TF is INVALID:**
1. **Yellow warning label** appears on chart: "⚠️ INTRABAR TF INVALID"
2. **Table shows**: "IB Data: ⚠️ INVALID TF" with yellow background
3. **Alert available**: "⚠️ INTRABAR CONFIG ERROR"
4. **Score impact**: Intrabar points (up to 5) are NOT added
**Example - 2 Minute Chart:**
```
VALID selections: 1T, 5T, 10T, 25T, 50T, 100T (any tick)
1S, 5S, 10S, 15S, 30S (any second)
1 (1-minute only)
INVALID selections: 2, 3, 5, 10, 15... (2min or higher)
D, W, M (obviously)
```
| Your Chart | Valid Intrabar Options |
|------------|------------------------|
| **2 minute** | **1T-1000T, 1S-30S, 1 only** |
| 5 minute | 1T-1000T, 1S-30S, 1-4 min |
| 15 minute | 1T-1000T, 1S-30S, 1-10 min |
| 1 hour | 1T-1000T, 1S-30S, 1-45 min |
| 4 hour | 1T-1000T, 1S-30S, 1-180 min |
| Daily | All tick, seconds, minutes up to 240 |
---
# 🎨 VISUAL FILTERING (v8 NEW!)
## The Problem (v7)
Too many sweep and absorption markers cluttered the chart with low-quality signals.
## The Solution (v8)
**Quality filters** - only show sweeps/absorption that MATTER.
### Sweep Quality Score
A sweep needs confluence to display:
```
+1.5 = In FVG Zone
+1.5 = In Order Block
+1.0 = Strong volume
+0.5 = In session
+1.0 = Intrabar confirmation
───────────────────
MIN NEEDED: 2.0 to show
```
### Absorption Quality Score
```
+1.5 = In FVG Zone
+1.5 = In Order Block
+1.0 = Tier signal present
+0.5 = In session
+0.5 = CVD confirmation
───────────────────
MIN NEEDED: 2.0 to show
```
### Settings
```
VISUAL FILTERS:
├── Only Show Quality Sweeps: ON (default)
├── Only Show Quality Absorption: ON (default)
├── Min Sweep Quality Score: 2.0
└── Min Absorption Quality Score: 2.0
Turn OFF filters to see ALL signals (not recommended)
```
---
# 📈 CVD IMPLEMENTATION (v8 FIXED)
## What Changed
### v7 Issues:
- CVD accumulated forever (overflow risk)
- Short slope calculation (only 3 bars)
- No session reset
### v8 Fixes:
```
1. SESSION RESET: CVD resets at London/NY open
2. PROPER SLOPE: Calculated over 5 bars
3. STDEV COMPARISON: Strong/Extreme = slope > 1-2 stdev
```
## CVD Readings in Table
| Display | Meaning | Score Contribution |
|---------|---------|-------------------|
| 🔥 BULL | Extreme bullish momentum | +1.5 total |
| 🔥 BEAR | Extreme bearish momentum | +1.5 total |
| ↑ BULL | Strong bullish trend | +1.0 total |
| ↓ BEAR | Strong bearish trend | +1.0 total |
| bull | Bullish bias | +0.5 |
| bear | Bearish bias | +0.5 |
| — | Neutral/mixed | +0 |
---
# ✅ ENTRY CHECKLIST v8
## Quick Checklist (Print This!)
### For ANY Signal:
- Score ≥ 3.5 (signal shown)
- Session active (🟢 in table)
- Direction matches bias
### For MEDIUM+ Signal (Score 5.0+):
- Delta matches direction (✓ or better)
- CVD trending with signal
- Volume ≥ 1.5x average
### For EXCELLENT Signal (Score 7.0+):
All above PLUS:
- In FVG Zone OR Order Block
- Strong delta (✓✓) or extreme (🔥)
- IB Delta confirms direction
### For GOD MODE (Score 8.5+):
All above PLUS:
- Multiple structure confluence (FVG + OB)
- Absorption or sweep present
- IB Momentum strong (🔥)
- **FULL SIZE - DON'T HESITATE**
---
# ⛔ DO NOT TRADE
1. **Score below threshold** - No signal shown = no trade
2. **Outside session** - Unless you've disabled session filter
3. **Delta conflicts** - Bearish candle but buy dominant delta
4. **No intrabar data** - Shows "0 bars" in IB Data
5. **CVD strongly opposite** - 🔥 BEAR on a long signal
6. **After major news** - Wait for dust to settle
7. **Low volume overall** - Market too quiet
---
# 🏆 GOLDEN RULES v8
> **"The score doesn't lie. Trust the math."**
> **"GOD MODE = Don't think, just execute."**
> **"Filtered visuals = Quality over quantity."**
> **"If intrabar conflicts, trust intrabar."**
> **"Session matters - trade when institutions trade."**
> **"Stack confluence - score higher = win more."**
> **"Leave every trade with money. Next setup is coming."**
---
# 📝 TRADE JOURNAL v8
```
DATE: ___________
SESSION: ☐ LDN ☐ NY ☐ PWR
INSTRUMENT: YM / NQ / ES / GC / BTC
TRADE:
├── Time: _______
├── Signal: ⚡GOD / S🎯 / A🎯 / B🎯 / Z
├── Direction: LONG / SHORT
├── SCORE: ___/10
├── Classification: GOD MODE / EXCELLENT / MEDIUM / WEAK
│
├── Entry: _______
├── Stop: _______
├── Target: _______
│
├── In FVG Zone: ☐ Yes ☐ No
├── In Order Block: ☐ Yes ☐ No
├── Liquidity Sweep: ☐ Yes ☐ No
├── Absorption: ☐ Yes ☐ No
│
├── IB Delta: ____% (BULL / BEAR / NEUTRAL)
├── IB Momentum: ____% (BULL / BEAR / MIXED)
├── CVD: 🔥 / ↑↓ / neutral
│
├── Result: +/- ___ pts ($_____)
└── Notes: _______________________
DAILY SUMMARY:
├── Total Trades: ___
├── GOD MODE signals: ___
├── EXCELLENT signals: ___
├── Win Rate: ___%
├── Net P/L: $_____
└── Best score today: ___
```
---
# 🔧 TROUBLESHOOTING
| Issue | Solution |
|-------|----------|
| **Yellow "INVALID TF" warning** | Your intrabar TF is >= chart TF. Select LOWER! |
| **IB Data shows "⚠️ INVALID TF"** | Same as above - pick 1T, 1S, or 1 for most charts |
| No signals appearing | Lower Min Score threshold |
| Too many signals | Raise Min Score threshold |
| Score always 0 | Check if candle is tiered (meets point threshold) |
| Sweeps not showing | Check quality filter settings or lower threshold |
| Table transparent | ❌ Fixed in v8 - table is now solid |
| CVD not making sense | Now resets at session open - cleaner readings |
| Wrong tier thresholds | Adjust for your instrument (see setup guide) |
| Tick TF not available | Requires TradingView Premium+ subscription |
---
# 📚 VERSION HISTORY
## v8 - WIN AT ALL COST EDITION
- ✅ REBUILT scoring system (100% additive, no gating)
- ✅ SOLID table (no transparency)
- ✅ ALL TradingView timeframes for intrabar (1S to Monthly)
- ✅ FILTERED sweeps/absorption (quality-based)
- ✅ FIXED CVD (session reset, proper slope)
- ✅ GOD MODE classification (8.5+ score)
- ✅ Instrument-specific documentation
## v7 - Intrabar Edition
- Added intrabar analysis engine
- Added absorption detection
- Added internal sweep detection
## Previous Versions
- GRA v5 SNIPER + DeepFlow Zones SNIPER merged
---
*© Alexandro Disla - YM Ultimate SNIPER v8*
*WIN AT ALL COST Edition | Trust The Score*

YM Ultimate SNIPER v8# YM Ultimate SNIPER v8 - Complete Documentation
## 🎯 WIN AT ALL COST EDITION
### FIXED: Scoring System + Solid Table + All Timeframes + Filtered Visuals
**TARGET: 3-7 High-Confluence Trades per Day**
**Philosophy: "Zones That Matter" + "See Inside The Candle"**
---
# 📋 QUICK START CHEATSHEET
## ⚡ 60-SECOND SETUP
### Step 1: Add to Chart
1. Open TradingView → Indicators → Pine Editor
2. Paste the v8 code → Save → Add to Chart
3. Use 5-minute chart for day trading
### Step 2: Verify Settings (YM Default)
```
TIER THRESHOLDS:
├── S-Tier: 50 points (institutional sweep)
├── A-Tier: 25 point# YM Ultimate SNIPER v8 - Complete Documentation
## 🎯 WIN AT ALL COST EDITION
### FIXED: Scoring System + Solid Table + All Timeframes + Filtered Visuals
**TARGET: 3-7 High-Confluence Trades per Day**
**Philosophy: "Zones That Matter" + "See Inside The Candle"**
---
# 📋 QUICK START CHEATSHEET
## ⚡ 60-SECOND SETUP
### Step 1: Add to Chart
1. Open TradingView → Indicators → Pine Editor
2. Paste the v8 code → Save → Add to Chart
3. Use 5-minute chart for day trading
### Step 2: Verify Settings (YM Default)
```
TIER THRESHOLDS:
├── S-Tier: 50 points (institutional sweep)
├── A-Tier: 25 points (strong momentum)
└── B-Tier: 12 points (quick scalp)
INTRABAR: 1-minute (most precise)
SESSIONS: NY Window (0930-1130) ← Primary focus
```
### Step 3: Look for These Signals
```
⚡GOD = GOD MODE (9.0+ score) → TAKE IT NOW, full size
S🎯 = S-Tier HOLD → 2.5-3.5 R:R target
A🎯 = A-Tier SWING → 2.0-2.5 R:R target
B🎯 = B-Tier SCALP → 1.5-2.0 R:R target
Z = Zone entry (no tier but quality zone)
LS↑/↓ = Liquidity Sweep (filtered for quality)
✕ = Absorption (filtered for quality)
```
---
# 🔥 THE SCORE SYSTEM (v8 REBUILT)
## How It Works Now
The score is **100% ADDITIVE** - no more gating. Every factor adds points:
| Category | Factor | Points |
|----------|--------|--------|
| **TIER** | S-Tier | +3.0 |
| | A-Tier | +2.0 |
| | B-Tier | +1.0 |
| **ZONES** | In FVG Zone | +1.5 |
| | In Order Block | +1.5 |
| | In IFVG | +1.0 |
| **VOLUME** | Meets minimum (1.5x) | +0.5 |
| | Strong (2.0x) | +0.75 |
| | Extreme (2.5x) | +0.75 |
| **DELTA** | Buy/Sell dominant (60%+) | +1.0 |
| | Strong (70%+) | +0.5 |
| | Extreme (78%+) | +0.5 |
| **CVD** | Bullish/Bearish | +0.5 |
| | Strong momentum | +0.5 |
| | Extreme momentum | +0.5 |
| **CANDLE** | Strong body (60%+) | +0.5 |
| | Significant range (1.2x avg) | +0.5 |
| | Clean wicks | +0.5 |
| **SWEEP** | Recent sweep (within 3 bars) | +1.5 |
| | Current bar sweep | +0.5 |
| **SESSION** | In key session | +1.0 |
| **INTRABAR** | IB Delta dominant | +1.0 |
| | IB Delta strong | +0.5 |
| | IB Delta extreme | +0.5 |
| | IB Momentum confirmed | +0.5 |
| | IB Momentum strong | +0.5 |
| | Absorption detected | +1.0 |
| | Internal sweep | +0.5 |
| | Volume cluster (favorable) | +0.5 |
**Max Raw Score: ~22 points → Normalized to 10**
## Score Classifications
| Score | Classification | Action | Size |
|-------|---------------|--------|------|
| **9.0-10** | ⚡ GOD MODE | TAKE IT NOW | Full position |
| **8.0-8.9** | ⭐ EXCELLENT | High priority | 75-100% size |
| **5.0-7.9** | 🟡 MEDIUM | Standard setup | 50-75% size |
| **<5.0** | ❌ NO SIGNAL | No trade | — |
---
# 📊 INSTRUMENT-SPECIFIC SETUP
## YM (Dow Jones Mini) - DEFAULT
```
TIER THRESHOLDS:
├── S-Tier: 50 points
├── A-Tier: 25 points
└── B-Tier: 12 points
TICK VALUE: 1.00 (1 tick = 1 point)
CONTRACT VALUE: $5 per point
RECOMMENDED:
├── Chart: 5-minute
├── Intrabar TF: 1 (1-minute) OR 100T (tick for Premium+)
├── Sessions: NY Open (9:30-11:30)
└── Stop: 2 ticks below signal candle low
PRO TIP: Use 100T or 250T tick intrabar for true order flow
```
## NQ (Nasdaq Mini)
```
TIER THRESHOLDS:
├── S-Tier: 100 points
├── A-Tier: 50 points
└── B-Tier: 25 points
TICK VALUE: 0.25 (4 ticks = 1 point)
CONTRACT VALUE: $5 per point ($20 per tick)
RECOMMENDED:
├── Chart: 5-minute
├── Intrabar TF: 1 (1-minute)
├── Min Volume Ratio: 1.8 (more volatile)
├── Delta Threshold: 0.62 (stricter)
└── Sessions: NY Open + Power Hour
```
## GC (Gold)
```
TIER THRESHOLDS:
├── S-Tier: 20 points (=$200)
├── A-Tier: 10 points (=$100)
└── B-Tier: 5 points (=$50)
TICK VALUE: 0.10 (10 ticks = 1 point)
CONTRACT VALUE: $10 per point ($1 per tick)
RECOMMENDED:
├── Chart: 5-minute
├── Intrabar TF: 1 (1-minute)
├── Sessions: London + NY overlap
├── Min Volume Ratio: 1.5
└── Note: More responsive to geopolitical events
```
## BTC (Bitcoin Futures)
```
TIER THRESHOLDS:
├── S-Tier: 500 points
├── A-Tier: 250 points
└── B-Tier: 100 points
TICK VALUE: 5.00 (1 tick = 5 points)
CONTRACT VALUE: $5 per point
RECOMMENDED:
├── Chart: 15-minute (less noise)
├── Intrabar TF: 5 (5-minute)
├── Sessions: Consider 24/7 (disable session filter)
├── Min Volume Ratio: 2.0 (crypto is spiky)
├── Absorption Threshold: 0.70 (stricter)
└── Note: Higher volatility, use wider stops
```
## ES (S&P 500 Mini)
```
TIER THRESHOLDS:
├── S-Tier: 20 points
├── A-Tier: 10 points
└── B-Tier: 5 points
TICK VALUE: 0.25 (4 ticks = 1 point)
CONTRACT VALUE: $12.50 per point ($50 per tick)
RECOMMENDED:
├── Chart: 5-minute
├── Intrabar TF: 1 (1-minute)
├── Sessions: NY Open (primary)
├── Note: Most liquid, cleanest price action
└── Good for learning the system
```
---
# 🕐 INTRABAR TIMEFRAME GUIDE
## Available Timeframes (v8 COMPLETE!)
### TICK TIMEFRAMES (Premium+ Required)
| Timeframe | Code | Best For |
|-----------|------|----------|
| 1 Tick | 1T | **ULTIMATE PRECISION** - every single trade |
| 5 Ticks | 5T | Ultra-precise scalping |
| 10 Ticks | 10T | High-frequency analysis |
| 25 Ticks | 25T | Tick scalping |
| 50 Ticks | 50T | Short-term tick analysis |
| 100 Ticks | 100T | Standard tick analysis |
| 250 Ticks | 250T | Medium tick grouping |
| 500 Ticks | 500T | Larger tick grouping |
| 1000 Ticks | 1000T | High-level tick view |
### SECOND TIMEFRAMES
| Timeframe | Code | Best For |
|-----------|------|----------|
| 1 Second | 1S | Ultra-scalping |
| 5 Seconds | 5S | Scalping, high-frequency |
| 10 Seconds | 10S | Fast scalping |
| 15 Seconds | 15S | Quick scalps |
| 30 Seconds | 30S | Short-term scalps |
### MINUTE TIMEFRAMES
| Timeframe | Code | Best For |
|-----------|------|----------|
| 1 Minute | 1 | **RECOMMENDED** for 5m charts |
| 2 Minutes | 2 | 10m charts |
| 3 Minutes | 3 | 15m charts |
| 5 Minutes | 5 | 15-30m charts |
| 10 Minutes | 10 | 30m-1h charts |
| 15 Minutes | 15 | 1h charts |
| 30 Minutes | 30 | 1-2h charts |
| 45 Minutes | 45 | 2-4h charts |
| 1 Hour | 60 | 4h charts |
| 2 Hours | 120 | Daily charts |
| 3 Hours | 180 | Daily charts |
| 4 Hours | 240 | Weekly charts |
### HIGHER TIMEFRAMES
| Timeframe | Code | Best For |
|-----------|------|----------|
| Daily | D | Weekly/Monthly charts |
| Weekly | W | Monthly charts |
| Monthly | M | Long-term analysis |
## 🔥 TICK DATA ADVANTAGE
**Why Use Tick Data?**
- **True Order Flow**: See every single transaction
- **No Time Aggregation**: Pure price/volume action
- **Institutional Footprint**: Catch block trades instantly
- **Maximum IB Precision**: Most accurate delta/momentum
**Best Tick Settings by Instrument:**
| Instrument | Chart TF | Recommended Tick IB |
|------------|----------|---------------------|
| YM | 5 min | 100T or 250T |
| NQ | 5 min | 50T or 100T (more liquid) |
| ES | 5 min | 50T or 100T (most liquid) |
| GC | 5 min | 100T or 250T |
| BTC | 15 min | 250T or 500T |
## ⚠️ CRITICAL RULE
**Intrabar TF MUST be LOWER than your chart TF!**
### Automatic Validation (v8 NEW!)
The script now automatically detects invalid intrabar configurations:
**When Intrabar TF is INVALID:**
1. **Yellow warning label** appears on chart: "⚠️ INTRABAR TF INVALID"
2. **Table shows**: "IB Data: ⚠️ INVALID TF" with yellow background
3. **Alert available**: "⚠️ INTRABAR CONFIG ERROR"
4. **Score impact**: Intrabar points (up to 5) are NOT added
**Example - 2 Minute Chart:**
```
VALID selections: 1T, 5T, 10T, 25T, 50T, 100T (any tick)
1S, 5S, 10S, 15S, 30S (any second)
1 (1-minute only)
INVALID selections: 2, 3, 5, 10, 15... (2min or higher)
D, W, M (obviously)
```
| Your Chart | Valid Intrabar Options |
|------------|------------------------|
| **2 minute** | **1T-1000T, 1S-30S, 1 only** |
| 5 minute | 1T-1000T, 1S-30S, 1-4 min |
| 15 minute | 1T-1000T, 1S-30S, 1-10 min |
| 1 hour | 1T-1000T, 1S-30S, 1-45 min |
| 4 hour | 1T-1000T, 1S-30S, 1-180 min |
| Daily | All tick, seconds, minutes up to 240 |
---
# 🎨 VISUAL FILTERING (v8 NEW!)
## The Problem (v7)
Too many sweep and absorption markers cluttered the chart with low-quality signals.
## The Solution (v8)
**Quality filters** - only show sweeps/absorption that MATTER.
### Sweep Quality Score
A sweep needs confluence to display:
```
+1.5 = In FVG Zone
+1.5 = In Order Block
+1.0 = Strong volume
+0.5 = In session
+1.0 = Intrabar confirmation
───────────────────
MIN NEEDED: 2.0 to show
```
### Absorption Quality Score
```
+1.5 = In FVG Zone
+1.5 = In Order Block
+1.0 = Tier signal present
+0.5 = In session
+0.5 = CVD confirmation
───────────────────
MIN NEEDED: 2.0 to show
```
### Settings
```
VISUAL FILTERS:
├── Only Show Quality Sweeps: ON (default)
├── Only Show Quality Absorption: ON (default)
├── Min Sweep Quality Score: 2.0
└── Min Absorption Quality Score: 2.0
Turn OFF filters to see ALL signals (not recommended)
```
---
# 📈 CVD IMPLEMENTATION (v8 FIXED)
## What Changed
### v7 Issues:
- CVD accumulated forever (overflow risk)
- Short slope calculation (only 3 bars)
- No session reset
### v8 Fixes:
```
1. SESSION RESET: CVD resets at London/NY open
2. PROPER SLOPE: Calculated over 5 bars
3. STDEV COMPARISON: Strong/Extreme = slope > 1-2 stdev
```
## CVD Readings in Table
| Display | Meaning | Score Contribution |
|---------|---------|-------------------|
| 🔥 BULL | Extreme bullish momentum | +1.5 total |
| 🔥 BEAR | Extreme bearish momentum | +1.5 total |
| ↑ BULL | Strong bullish trend | +1.0 total |
| ↓ BEAR | Strong bearish trend | +1.0 total |
| bull | Bullish bias | +0.5 |
| bear | Bearish bias | +0.5 |
| — | Neutral/mixed | +0 |
---
# ✅ ENTRY CHECKLIST v8
## Quick Checklist (Print This!)
### For ANY Signal:
- Score ≥ 3.5 (signal shown)
- Session active (🟢 in table)
- Direction matches bias
### For MEDIUM+ Signal (Score 5.0+):
- Delta matches direction (✓ or better)
- CVD trending with signal
- Volume ≥ 1.5x average
### For EXCELLENT Signal (Score 7.0+):
All above PLUS:
- In FVG Zone OR Order Block
- Strong delta (✓✓) or extreme (🔥)
- IB Delta confirms direction
### For GOD MODE (Score 8.5+):
All above PLUS:
- Multiple structure confluence (FVG + OB)
- Absorption or sweep present
- IB Momentum strong (🔥)
- **FULL SIZE - DON'T HESITATE**
---
# ⛔ DO NOT TRADE
1. **Score below threshold** - No signal shown = no trade
2. **Outside session** - Unless you've disabled session filter
3. **Delta conflicts** - Bearish candle but buy dominant delta
4. **No intrabar data** - Shows "0 bars" in IB Data
5. **CVD strongly opposite** - 🔥 BEAR on a long signal
6. **After major news** - Wait for dust to settle
7. **Low volume overall** - Market too quiet
---
# 🏆 GOLDEN RULES v8
> **"The score doesn't lie. Trust the math."**
> **"GOD MODE = Don't think, just execute."**
> **"Filtered visuals = Quality over quantity."**
> **"If intrabar conflicts, trust intrabar."**
> **"Session matters - trade when institutions trade."**
> **"Stack confluence - score higher = win more."**
> **"Leave every trade with money. Next setup is coming."**
---
# 📝 TRADE JOURNAL v8
```
DATE: ___________
SESSION: ☐ LDN ☐ NY ☐ PWR
INSTRUMENT: YM / NQ / ES / GC / BTC
TRADE:
├── Time: _______
├── Signal: ⚡GOD / S🎯 / A🎯 / B🎯 / Z
├── Direction: LONG / SHORT
├── SCORE: ___/10
├── Classification: GOD MODE / EXCELLENT / MEDIUM / WEAK
│
├── Entry: _______
├── Stop: _______
├── Target: _______
│
├── In FVG Zone: ☐ Yes ☐ No
├── In Order Block: ☐ Yes ☐ No
├── Liquidity Sweep: ☐ Yes ☐ No
├── Absorption: ☐ Yes ☐ No
│
├── IB Delta: ____% (BULL / BEAR / NEUTRAL)
├── IB Momentum: ____% (BULL / BEAR / MIXED)
├── CVD: 🔥 / ↑↓ / neutral
│
├── Result: +/- ___ pts ($_____)
└── Notes: _______________________
DAILY SUMMARY:
├── Total Trades: ___
├── GOD MODE signals: ___
├── EXCELLENT signals: ___
├── Win Rate: ___%
├── Net P/L: $_____
└── Best score today: ___
```
---
# 🔧 TROUBLESHOOTING
| Issue | Solution |
|-------|----------|
| **Yellow "INVALID TF" warning** | Your intrabar TF is >= chart TF. Select LOWER! |
| **IB Data shows "⚠️ INVALID TF"** | Same as above - pick 1T, 1S, or 1 for most charts |
| No signals appearing | Lower Min Score threshold |
| Too many signals | Raise Min Score threshold |
| Score always 0 | Check if candle is tiered (meets point threshold) |
| Sweeps not showing | Check quality filter settings or lower threshold |
| Table transparent | ❌ Fixed in v8 - table is now solid |
| CVD not making sense | Now resets at session open - cleaner readings |
| Wrong tier thresholds | Adjust for your instrument (see setup guide) |
| Tick TF not available | Requires TradingView Premium+ subscription |
---
# 📚 VERSION HISTORY
## v8 - WIN AT ALL COST EDITION
- ✅ REBUILT scoring system (100% additive, no gating)
- ✅ SOLID table (no transparency)
- ✅ ALL TradingView timeframes for intrabar (1S to Monthly)
- ✅ FILTERED sweeps/absorption (quality-based)
- ✅ FIXED CVD (session reset, proper slope)
- ✅ GOD MODE classification (8.5+ score)
- ✅ Instrument-specific documentation
## v7 - Intrabar Edition
- Added intrabar analysis engine
- Added absorption detection
- Added internal sweep detection
## Previous Versions
- GRA v5 SNIPER + DeepFlow Zones SNIPER merged
---
*© Alexandro Disla - YM Ultimate SNIPER v8*
*WIN AT ALL COST Edition | Trust The Score*
s (strong momentum)
└── B-Tier: 12 points (quick scalp)
INTRABAR: 1-minute (most precise)
SESSIONS: NY Window (0930-1130) ← Primary focus
```
### Step 3: Look for These Signals
```
⚡GOD = GOD MODE (9.0+ score) → TAKE IT NOW, full size
S🎯 = S-Tier HOLD → 2.5-3.5 R:R target
A🎯 = A-Tier SWING → 2.0-2.5 R:R target
B🎯 = B-Tier SCALP → 1.5-2.0 R:R target
Z = Zone entry (no tier but quality zone)
LS↑/↓ = Liquidity Sweep (filtered for quality)
✕ = Absorption (filtered for quality)
```
---
# 🔥 THE SCORE SYSTEM (v8 REBUILT)
## How It Works Now
The score is **100% ADDITIVE** - no more gating. Every factor adds points:
| Category | Factor | Points |
|----------|--------|--------|
| **TIER** | S-Tier | +3.0 |
| | A-Tier | +2.0 |
| | B-Tier | +1.0 |
| **ZONES** | In FVG Zone | +1.5 |
| | In Order Block | +1.5 |
| | In IFVG | +1.0 |
| **VOLUME** | Meets minimum (1.5x) | +0.5 |
| | Strong (2.0x) | +0.75 |
| | Extreme (2.5x) | +0.75 |
| **DELTA** | Buy/Sell dominant (60%+) | +1.0 |
| | Strong (70%+) | +0.5 |
| | Extreme (78%+) | +0.5 |
| **CVD** | Bullish/Bearish | +0.5 |
| | Strong momentum | +0.5 |
| | Extreme momentum | +0.5 |
| **CANDLE** | Strong body (60%+) | +0.5 |
| | Significant range (1.2x avg) | +0.5 |
| | Clean wicks | +0.5 |
| **SWEEP** | Recent sweep (within 3 bars) | +1.5 |
| | Current bar sweep | +0.5 |
| **SESSION** | In key session | +1.0 |
| **INTRABAR** | IB Delta dominant | +1.0 |
| | IB Delta strong | +0.5 |
| | IB Delta extreme | +0.5 |
| | IB Momentum confirmed | +0.5 |
| | IB Momentum strong | +0.5 |
| | Absorption detected | +1.0 |
| | Internal sweep | +0.5 |
| | Volume cluster (favorable) | +0.5 |
**Max Raw Score: ~22 points → Normalized to 10**
## Score Classifications
| Score | Classification | Action | Size |
|-------|---------------|--------|------|
| **9.0-10** | ⚡ GOD MODE | TAKE IT NOW | Full position |
| **8.0-8.9** | ⭐ EXCELLENT | High priority | 75-100% size |
| **5.0-7.9** | 🟡 MEDIUM | Standard setup | 50-75% size |
| **<5.0** | ❌ NO SIGNAL | No trade | — |
---
# 📊 INSTRUMENT-SPECIFIC SETUP
## YM (Dow Jones Mini) - DEFAULT
```
TIER THRESHOLDS:
├── S-Tier: 50 points
├── A-Tier: 25 points
└── B-Tier: 12 points
TICK VALUE: 1.00 (1 tick = 1 point)
CONTRACT VALUE: $5 per point
RECOMMENDED:
├── Chart: 5-minute
├── Intrabar TF: 1 (1-minute) OR 100T (tick for Premium+)
├── Sessions: NY Open (9:30-11:30)
└── Stop: 2 ticks below signal candle low
PRO TIP: Use 100T or 250T tick intrabar for true order flow
```
## NQ (Nasdaq Mini)
```
TIER THRESHOLDS:
├── S-Tier: 100 points
├── A-Tier: 50 points
└── B-Tier: 25 points
TICK VALUE: 0.25 (4 ticks = 1 point)
CONTRACT VALUE: $5 per point ($20 per tick)
RECOMMENDED:
├── Chart: 5-minute
├── Intrabar TF: 1 (1-minute)
├── Min Volume Ratio: 1.8 (more volatile)
├── Delta Threshold: 0.62 (stricter)
└── Sessions: NY Open + Power Hour
```
## GC (Gold)
```
TIER THRESHOLDS:
├── S-Tier: 20 points (=$200)
├── A-Tier: 10 points (=$100)
└── B-Tier: 5 points (=$50)
TICK VALUE: 0.10 (10 ticks = 1 point)
CONTRACT VALUE: $10 per point ($1 per tick)
RECOMMENDED:
├── Chart: 5-minute
├── Intrabar TF: 1 (1-minute)
├── Sessions: London + NY overlap
├── Min Volume Ratio: 1.5
└── Note: More responsive to geopolitical events
```
## BTC (Bitcoin Futures)
```
TIER THRESHOLDS:
├── S-Tier: 500 points
├── A-Tier: 250 points
└── B-Tier: 100 points
TICK VALUE: 5.00 (1 tick = 5 points)
CONTRACT VALUE: $5 per point
RECOMMENDED:
├── Chart: 15-minute (less noise)
├── Intrabar TF: 5 (5-minute)
├── Sessions: Consider 24/7 (disable session filter)
├── Min Volume Ratio: 2.0 (crypto is spiky)
├── Absorption Threshold: 0.70 (stricter)
└── Note: Higher volatility, use wider stops
```
## ES (S&P 500 Mini)
```
TIER THRESHOLDS:
├── S-Tier: 20 points
├── A-Tier: 10 points
└── B-Tier: 5 points
TICK VALUE: 0.25 (4 ticks = 1 point)
CONTRACT VALUE: $12.50 per point ($50 per tick)
RECOMMENDED:
├── Chart: 5-minute
├── Intrabar TF: 1 (1-minute)
├── Sessions: NY Open (primary)
├── Note: Most liquid, cleanest price action
└── Good for learning the system
```
---
# 🕐 INTRABAR TIMEFRAME GUIDE
## Available Timeframes (v8 COMPLETE!)
### TICK TIMEFRAMES (Premium+ Required)
| Timeframe | Code | Best For |
|-----------|------|----------|
| 1 Tick | 1T | **ULTIMATE PRECISION** - every single trade |
| 5 Ticks | 5T | Ultra-precise scalping |
| 10 Ticks | 10T | High-frequency analysis |
| 25 Ticks | 25T | Tick scalping |
| 50 Ticks | 50T | Short-term tick analysis |
| 100 Ticks | 100T | Standard tick analysis |
| 250 Ticks | 250T | Medium tick grouping |
| 500 Ticks | 500T | Larger tick grouping |
| 1000 Ticks | 1000T | High-level tick view |
### SECOND TIMEFRAMES
| Timeframe | Code | Best For |
|-----------|------|----------|
| 1 Second | 1S | Ultra-scalping |
| 5 Seconds | 5S | Scalping, high-frequency |
| 10 Seconds | 10S | Fast scalping |
| 15 Seconds | 15S | Quick scalps |
| 30 Seconds | 30S | Short-term scalps |
### MINUTE TIMEFRAMES
| Timeframe | Code | Best For |
|-----------|------|----------|
| 1 Minute | 1 | **RECOMMENDED** for 5m charts |
| 2 Minutes | 2 | 10m charts |
| 3 Minutes | 3 | 15m charts |
| 5 Minutes | 5 | 15-30m charts |
| 10 Minutes | 10 | 30m-1h charts |
| 15 Minutes | 15 | 1h charts |
| 30 Minutes | 30 | 1-2h charts |
| 45 Minutes | 45 | 2-4h charts |
| 1 Hour | 60 | 4h charts |
| 2 Hours | 120 | Daily charts |
| 3 Hours | 180 | Daily charts |
| 4 Hours | 240 | Weekly charts |
### HIGHER TIMEFRAMES
| Timeframe | Code | Best For |
|-----------|------|----------|
| Daily | D | Weekly/Monthly charts |
| Weekly | W | Monthly charts |
| Monthly | M | Long-term analysis |
## 🔥 TICK DATA ADVANTAGE
**Why Use Tick Data?**
- **True Order Flow**: See every single transaction
- **No Time Aggregation**: Pure price/volume action
- **Institutional Footprint**: Catch block trades instantly
- **Maximum IB Precision**: Most accurate delta/momentum
**Best Tick Settings by Instrument:**
| Instrument | Chart TF | Recommended Tick IB |
|------------|----------|---------------------|
| YM | 5 min | 100T or 250T |
| NQ | 5 min | 50T or 100T (more liquid) |
| ES | 5 min | 50T or 100T (most liquid) |
| GC | 5 min | 100T or 250T |
| BTC | 15 min | 250T or 500T |
## ⚠️ CRITICAL RULE
**Intrabar TF MUST be LOWER than your chart TF!**
### Automatic Validation (v8 NEW!)
The script now automatically detects invalid intrabar configurations:
**When Intrabar TF is INVALID:**
1. **Yellow warning label** appears on chart: "⚠️ INTRABAR TF INVALID"
2. **Table shows**: "IB Data: ⚠️ INVALID TF" with yellow background
3. **Alert available**: "⚠️ INTRABAR CONFIG ERROR"
4. **Score impact**: Intrabar points (up to 5) are NOT added
**Example - 2 Minute Chart:**
```
VALID selections: 1T, 5T, 10T, 25T, 50T, 100T (any tick)
1S, 5S, 10S, 15S, 30S (any second)
1 (1-minute only)
INVALID selections: 2, 3, 5, 10, 15... (2min or higher)
D, W, M (obviously)
```
| Your Chart | Valid Intrabar Options |
|------------|------------------------|
| **2 minute** | **1T-1000T, 1S-30S, 1 only** |
| 5 minute | 1T-1000T, 1S-30S, 1-4 min |
| 15 minute | 1T-1000T, 1S-30S, 1-10 min |
| 1 hour | 1T-1000T, 1S-30S, 1-45 min |
| 4 hour | 1T-1000T, 1S-30S, 1-180 min |
| Daily | All tick, seconds, minutes up to 240 |
---
# 🎨 VISUAL FILTERING (v8 NEW!)
## The Problem (v7)
Too many sweep and absorption markers cluttered the chart with low-quality signals.
## The Solution (v8)
**Quality filters** - only show sweeps/absorption that MATTER.
### Sweep Quality Score
A sweep needs confluence to display:
```
+1.5 = In FVG Zone
+1.5 = In Order Block
+1.0 = Strong volume
+0.5 = In session
+1.0 = Intrabar confirmation
───────────────────
MIN NEEDED: 2.0 to show
```
### Absorption Quality Score
```
+1.5 = In FVG Zone
+1.5 = In Order Block
+1.0 = Tier signal present
+0.5 = In session
+0.5 = CVD confirmation
───────────────────
MIN NEEDED: 2.0 to show
```
### Settings
```
VISUAL FILTERS:
├── Only Show Quality Sweeps: ON (default)
├── Only Show Quality Absorption: ON (default)
├── Min Sweep Quality Score: 2.0
└── Min Absorption Quality Score: 2.0
Turn OFF filters to see ALL signals (not recommended)
```
---
# 📈 CVD IMPLEMENTATION (v8 FIXED)
## What Changed
### v7 Issues:
- CVD accumulated forever (overflow risk)
- Short slope calculation (only 3 bars)
- No session reset
### v8 Fixes:
```
1. SESSION RESET: CVD resets at London/NY open
2. PROPER SLOPE: Calculated over 5 bars
3. STDEV COMPARISON: Strong/Extreme = slope > 1-2 stdev
```
## CVD Readings in Table
| Display | Meaning | Score Contribution |
|---------|---------|-------------------|
| 🔥 BULL | Extreme bullish momentum | +1.5 total |
| 🔥 BEAR | Extreme bearish momentum | +1.5 total |
| ↑ BULL | Strong bullish trend | +1.0 total |
| ↓ BEAR | Strong bearish trend | +1.0 total |
| bull | Bullish bias | +0.5 |
| bear | Bearish bias | +0.5 |
| — | Neutral/mixed | +0 |
---
# ✅ ENTRY CHECKLIST v8
## Quick Checklist (Print This!)
### For ANY Signal:
- Score ≥ 3.5 (signal shown)
- Session active (🟢 in table)
- Direction matches bias
### For MEDIUM+ Signal (Score 5.0+):
- Delta matches direction (✓ or better)
- CVD trending with signal
- Volume ≥ 1.5x average
### For EXCELLENT Signal (Score 7.0+):
All above PLUS:
- In FVG Zone OR Order Block
- Strong delta (✓✓) or extreme (🔥)
- IB Delta confirms direction
### For GOD MODE (Score 8.5+):
All above PLUS:
- Multiple structure confluence (FVG + OB)
- Absorption or sweep present
- IB Momentum strong (🔥)
- **FULL SIZE - DON'T HESITATE**
---
# ⛔ DO NOT TRADE
1. **Score below threshold** - No signal shown = no trade
2. **Outside session** - Unless you've disabled session filter
3. **Delta conflicts** - Bearish candle but buy dominant delta
4. **No intrabar data** - Shows "0 bars" in IB Data
5. **CVD strongly opposite** - 🔥 BEAR on a long signal
6. **After major news** - Wait for dust to settle
7. **Low volume overall** - Market too quiet
---
# 🏆 GOLDEN RULES v8
> **"The score doesn't lie. Trust the math."**
> **"GOD MODE = Don't think, just execute."**
> **"Filtered visuals = Quality over quantity."**
> **"If intrabar conflicts, trust intrabar."**
> **"Session matters - trade when institutions trade."**
> **"Stack confluence - score higher = win more."**
> **"Leave every trade with money. Next setup is coming."**
---
# 📝 TRADE JOURNAL v8
```
DATE: ___________
SESSION: ☐ LDN ☐ NY ☐ PWR
INSTRUMENT: YM / NQ / ES / GC / BTC
TRADE:
├── Time: _______
├── Signal: ⚡GOD / S🎯 / A🎯 / B🎯 / Z
├── Direction: LONG / SHORT
├── SCORE: ___/10
├── Classification: GOD MODE / EXCELLENT / MEDIUM / WEAK
│
├── Entry: _______
├── Stop: _______
├── Target: _______
│
├── In FVG Zone: ☐ Yes ☐ No
├── In Order Block: ☐ Yes ☐ No
├── Liquidity Sweep: ☐ Yes ☐ No
├── Absorption: ☐ Yes ☐ No
│
├── IB Delta: ____% (BULL / BEAR / NEUTRAL)
├── IB Momentum: ____% (BULL / BEAR / MIXED)
├── CVD: 🔥 / ↑↓ / neutral
│
├── Result: +/- ___ pts ($_____)
└── Notes: _______________________
DAILY SUMMARY:
├── Total Trades: ___
├── GOD MODE signals: ___
├── EXCELLENT signals: ___
├── Win Rate: ___%
├── Net P/L: $_____
└── Best score today: ___
```
---
# 🔧 TROUBLESHOOTING
| Issue | Solution |
|-------|----------|
| **Yellow "INVALID TF" warning** | Your intrabar TF is >= chart TF. Select LOWER! |
| **IB Data shows "⚠️ INVALID TF"** | Same as above - pick 1T, 1S, or 1 for most charts |
| No signals appearing | Lower Min Score threshold |
| Too many signals | Raise Min Score threshold |
| Score always 0 | Check if candle is tiered (meets point threshold) |
| Sweeps not showing | Check quality filter settings or lower threshold |
| Table transparent | ❌ Fixed in v8 - table is now solid |
| CVD not making sense | Now resets at session open - cleaner readings |
| Wrong tier thresholds | Adjust for your instrument (see setup guide) |
| Tick TF not available | Requires TradingView Premium+ subscription |
---
# 📚 VERSION HISTORY
## v8 - WIN AT ALL COST EDITION
- ✅ REBUILT scoring system (100% additive, no gating)
- ✅ SOLID table (no transparency)
- ✅ ALL TradingView timeframes for intrabar (1S to Monthly)
- ✅ FILTERED sweeps/absorption (quality-based)
- ✅ FIXED CVD (session reset, proper slope)
- ✅ GOD MODE classification (8.5+ score)
- ✅ Instrument-specific documentation
## v7 - Intrabar Edition
- Added intrabar analysis engine
- Added absorption detection
- Added internal sweep detection
## Previous Versions
- GRA v5 SNIPER + DeepFlow Zones SNIPER merged
---
*© Alexandro Disla - YM Ultimate SNIPER v8*
*WIN AT ALL COST Edition | Trust The Score*

UM VIX30/VIX Regime & Volatility Roll Yield
SUMMARY
A front-of-the-curve volatility indicator that compares spot VIX to a synthetic 30-day VIX (VIX30) built from VX1/VX2 futures, revealing early volatility pressure, regime shifts, and roll-yield transitions. Ideal for timing long/short volatility trades in VXX, UVXY, SVIX, and VIX futures.
DESCRIPTION
This indicator compares spot VIX to a synthetic 30-day constant-maturity volatility estimate (“VIX30”) built from VX1 and VX2 futures. The VIX30/VIX Ratio reveals short-term volatility pressure and regime shifts that traditional VX1/VX2 roll-yield alone often misses.
VIX30 is constructed using true calendar-day interpolation between VX1 and VX2, with VX1% and VX2% showing the real-time weights behind the 30-day volatility anchor. The table displays the volatility regime, the VX1/VX2 weights, spot-term roll yield (VIX30/VIX), and futures-term roll yield (VX2/VX1), giving a complete, front-of-the-curve perspective on volatility dynamics.
Use this to spot early volatility expansions, collapsing contango, and regime transitions that influence VXX, UVXY, SVIX, VX options, and VIX futures.
HOW IT WORKS
The script calculates the exact calendar days to expiration for the front two VIX futures. It then applies linear interpolation to blend VX1 and VX2 into a 30-day constant-maturity synthetic volatility measure (“VIX30”). Comparing VIX30 to spot VIX produces the VIX30/VIX Ratio, which highlights short-term volatility pressure and regime direction. A full term-structure table summarizes regime, VX1%/VX2% weights, and both spot-term and futures-term roll yields.
DEFAULT SETTINGS
VX1! and VX2! are used by default for front-month and second-month futures. These may be manually overridden if TradingView rolls contracts early. The default timeframe is 30 minutes, and the VIX30/VIX Ratio uses a 21-period EMA for regime smoothing. The historical threshold is set to 1.08, reflecting the long-run average relationship between VIX30 and VIX.
SUGGESTED USES
• Identify early volatility expansions before they appear in VX1/VX2 roll yield.
• Confirm contango/backwardation shifts with front-of-curve context.
• Time long/short volatility trades in VXX, UVXY, SVIX, and VX options.
• Monitor regime transitions (Low → Cautionary → High) to anticipate trend inflections.
• Combine with price action, Nadaraya-Watson trends, or MA color-flip systems for higher-confidence entries.
• MA red → green flips may signal opportunities to short volatility or increase equity exposure.
• MA green → red flips may signal opportunities to go long volatility, reduce equity exposure, or take short-equity positions.
ALERTS
Alerts trigger when the ratio crosses above or below the historical threshold or when the moving-average slope flips direction. A green flip signals rising volatility pressure; a red flip signals fading or collapsing volatility. These alert conditions can be used to automate long/short volatility bias shifts or trade-entry notifications.
FURTHER HINTS
• Increasing orange/red in the table suggests an emerging higher-volatility environment.
• SVIX (inverse volatility ETF) can trend strongly when volatility decays; on a 6-hour chart, MA green flips often align with attractive short-volatility opportunities.
• For long-volatility trades, consider shrinking to a 30-minute chart and watching for MA green → red flips as early entry cues.
• Experiment with different timeframes and smoothing lengths to match your trading style.
• Higher VIX30/VIX and VX2/VX1 roll yields generally imply faster decay in VXX, UVXY, and UVIX — or stronger upside momentum in SVIX.
• The author likes the 6-hour chart for short vol, and the 30-minute chart for long vol. Long vol trades are fast and furious so you want to be quick.

DCA Ladder CalculatorThis script is a DCA (Dollar-Cost Averaging) Ladder Calculator with Risk & Leverage Management baked in.
It’s designed for both LONG and SHORT positions, and helps you:
🎯 Strategically scale into positions across multiple entry points
🔐 Control risk exposure via defined capital allocation
⚖️ Utilize leverage responsibly — for efficiency, not destruction
🧮 Visualize risk, stop loss level, and entry distribution
🔁 Adapt to trend reversals or key zones, especially when combined with reversal indicators or higher timeframe signals
🧠 How It Works
This tool takes a capital allocation approach to building a ladder of positions:
1. You define:
- Portfolio value
- Risk per trade (as %)
- Leverage
- Number of DCA levels
- Entry multiplier (e.g. 1x, 2x, 4x...)
2. The script then:
- Calculates total margin to risk = Portfolio × Risk %
- Calculates total leveraged position size = Margin × Leverage
- Distributes entries according to exponential weights (1x, 2x, 4x...), totaling 7 for 3 levels
- Calculates per-entry:
- Entry price (based on price zone spacing)
- Multiplier
- Exact margin per entry
- Leverage per entry (margin × leverage)
- Computes:
- Average entry price (margin-weighted)
- Approximate stop loss level based on recent ATR and price structure
- % drawdown to SL
- Total margin and position size
3. Displays all this in a clean on-chart table.
📈 How to Use It
1. Apply the indicator to a chart (default: 1D — ideal for clean zones).
2. Configure your:
- Portfolio Value (total trading capital)
- Risk per Trade (%) (your acceptable loss)
- Leverage (exchange or strategy-based)
- DCA Levels (e.g. 3 = anchor + 2 entries)
- Multiplier (typically 2.0 for doubling)
3. Choose LONG or SHORT mode depending on direction.
4. The table will show:
- Entry price ladder
- Margin used per entry
- Total position size
- Approx. stop loss (where your full risk is defined)
Use in conjunction with price action, S/R zones, trendline breaks, volume divergence, or reversal indicators.
✅ Best Practices for Using This Tool
- Leverage is a tool, not a weapon. Use it to scale smartly — not recklessly.
- Use fewer, higher-conviction entries. Don’t blindly ladder; combine with price structure and signals.
- Stick to your risk percent. Never risk more than you can afford to lose. Let this calculator enforce discipline.
- Combine with other confirmation tools, like RSI divergence, momentum shifts, OB zones, etc.
- Avoid martingale-style over-exposure. This is not a gambling tool — it’s for capital efficiency.
🛡️ What This Tool Does NOT Do
- This is not a trade signal indicator.
- It does not place trades or auto-manage positions.
- It does not replace personal responsibility or strategy — it's a tool to help apply structure.
⚠️ Disclaimer
This script is for educational and informational purposes only.
It does not constitute financial advice, nor is it a recommendation to buy or sell any financial instrument.
Always consult a licensed financial advisor before making investment decisions.
Use of leverage involves high risk and can lead to substantial losses.
The author and publisher assume no liability for any trading losses resulting from use of this script.

Altcoin Relative Macro StrengthAltcoin Relative Macro Strength
Overview
The Altcoin Relative Macro Strength indicator measures the altcoin market's price performance relative to global macroeconomic conditions. By comparing TOTAL3ES (total altcoin market capitalization excluding Bitcoin, Ethereum and stable coins) against a composite macro trend, the indicator identifies periods of relative overvaluation and undervaluation.
Methodology
Global Macro Trend Calculation:
The macro trend synthesizes three primary components:
- ISM PMI – A proxy for the business cycle phase
- Global Liquidity – An aggregate measure of major central bank balance sheets and broad money supply
- IWM (Russell 2000) – Small-cap equity exposure, reflecting risk-on/risk-off market sentiment
Global Liquidity is calculated as:
Fed Balance Sheet - Reverse Repo - Treasury General Account + U.S. M2 + China M2
The final Global Macro Trend is:
ISM PMI × Global Liquidity × IWM
Theoretical Framework:
The global macro trend integrates liquidity expansion/contraction with business cycle dynamics and small-cap equity performance. The inclusion of IWM reflects altcoins' tendency to behave as high-beta risk assets, exhibiting sensitivity similar to small-cap equities. This composite exhibits strong directional correlation with altcoin market movements, capturing the risk-on/risk-off dynamics that drive altcoin performance.
Interpretation
Primary Signal:
The histogram displays the rolling percentage change of TOTAL3ES relative to the global macro trend (default: 21-period average). Positive divergence indicates altcoins are outperforming macro conditions; negative divergence suggests underperformance relative to the underlying economic and risk environment.
Data Tables:
Alts/Macro Change – Percentage deviation of the altcoin market's average value from the Global Macro Trend's average over the specified period
Macro Trend – Directional assessment of the macro trend based on slope and trend agreement:
🔵 BULLISH ▲ – Positive slope with upward trend
⚪ NEUTRAL → – Slope and trend direction disagree
🟣 BEARISH ▼ – Negative slope with downward trend
Macro Slope – Percentage rate of change in the global macro trend
Altcoin Valuation – Relative valuation category based on TOTAL3/Macro deviation:
🟢 Extreme Discount / Deep Discount / Discount
🟡 Fair Value
🔴 Premium / Large Premium / Extreme Premium
TOTAL3ES Mcap – Current total altcoin market capitalization (in billions)
Visual Components:
📊 Histogram: Alts/Macro Change
🟢 Green = Positive deviation (altcoins outperforming)
🔴 Red = Negative deviation (altcoins underperforming)
📈 Macro Slope Line
Color-coded to match trend assessment
Scaled for visibility (adjustable in settings)
Application
This indicator is designed to identify mean reversion opportunities by highlighting periods when the altcoin market materially diverges from fundamental macro and risk conditions. Extreme positive values may indicate overvaluation; extreme negative values may signal undervaluation relative to the prevailing economic and risk appetite backdrop.
Strategy Considerations:
- Identify extremes: Look for periods when the histogram reaches elevated positive or negative levels
- Assess valuation: Use the Altcoin Valuation reading to gauge relative over/undervaluation
Confirm with risk sentiment: Check whether macro conditions and risk appetite support or contradict current price levels
- Mean reversion: Consider that significant deviations from trend historically tend to revert
Note: This indicator identifies relative valuation based on macro conditions and risk sentiment—it does not predict price direction or timing.
Settings
Lookback Period – 21 bars (default) – Number of bars for calculating rolling averages
Macro Slope Scale – 3.0 (default) – Multiplier for macro slope line visibility
